ORELAPIRON LaboratoriesNELAP Accredited Laboratory

ORELAP Cert No. 4092-002
OLCC No. 1002158CD2E

Marijuana Potency Analysis by
High Performance Liquid Chromatography

Testing Accreditation #: 4092-002 Test Certificate #: 98760-001
Client Name, Sample Details

Chalice Farms
Portland, OR 97224
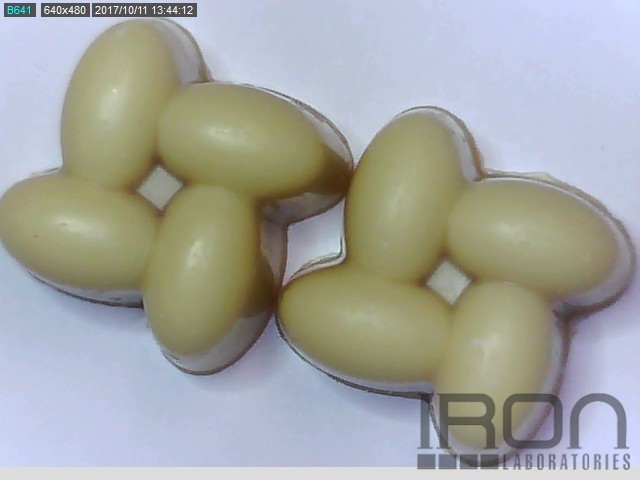
Sample: Pumpkin Spice Truffle
Type: Infused Product
Method: FE04E-OR4 HPLC1100-OR1
Metrc Test Pkg#: 1A4010300003E83000003307

Test Conditions

Prepsheet ID#: P171009A
Scale: XS205-OR1
Temp: 20 °C
Baro Pressure: 1009 hPa
Analyst: HRM
Technician: HRM

Sample ID#: 98760

Lot #: PST-171011
Batch #: 98760
Batch Weight (g): 15
Harvest/Process Date: 10/10/2017
Serving Size (g): 2.41
Package Weight (g):19.26
Date Received: 10/11/2017
Test Date: 10/13/2017

Sample #98760
Sample #98760 Sample #98760
Test
Compounds
CBDV CBDA CBD CBC CBG CBN THC THCA THCV   AVG CBD Decarb. % THC Decarb. %
Amount N/D N/D 0.01 mg/g 0.25 mg/g 0.07 mg/g 0.04 mg/g 2.29 mg/g N/D N/D THC 2.29 mg/g 100% 100%
LOQ 0.006 mg/g 0.006 mg/g 0.006 mg/g 0.006 mg/g 0.006 mg/g 0.006 mg/g 0.006 mg/g 0.006 mg/g 0.006 mg/g CBD 0.01 mg/g - -
Amount per Serving~ N/D N/D 0.02 mg/srv 0.60 mg/srv 0.17 mg/srv 0.10 mg/srv 5.52 mg/srv N/D N/D - Serving Size~ (g): 2.41 g -
Uncertainty 0.88% RPD 1.25% RPD 2.20% RPD 1.59% RPD 2.31% RPD 1.67% RPD ±5% RPD 2.09% RPD 0.37% RPD - - - -

E. coli Testing (FE-37-OR3) : PASS
Salmonella Testing (FE-56-OR1) : PASS

Serving size = 1 Pumpkin Spice Truffle = 2.41 grams

LOQ = Limit of Quantitation

RPD is relative percent difference between the LCS and LCS duplicate.

%RPD = Relative Percent Difference; Min. Value = Minimum Detectable Amount, CFU = Colony Forming Units, N/D = Not Detected

*** Designated tests that use the method FE-45.

Total CBD or THC is the calculated sum of CBD or THC and the amount of CBD or THC derived from CBDA or THCA, respectively. These values are calculated by adding a molar correction factor of 0.877 to the CBDA or THCA value.

THC and CBD Decarb. % referes to the percentage of THC or CBD relative to THCA or CBDA, respectively

Avg. is the calculated average of total CBD or total THC for all increments tested.

SOP FE-01-OR9 was used in accordance with OAR 333-007 for sampling. All marijuana items are sampled and tested in accordance with OAR 333-007-0300 to 333-007-490 and OAR 333-064-0100 to 333-064-0110.

This certificate shall not be reproduced except in full, without written approval of Iron Laboratories, LLC.

Joseph Rutowski Iron laboratories Joseph Rutowski

Iron Labs Oregon complies with 2009 TNI Environmental Laboratory Standards.

Tested by Iron Laboratories Oregon, 71 Centennial Loop Suite D Eugene, OR 97401

Page 1 of 2

ORELAPIRON LaboratoriesNELAP Accredited Laboratory

ORELAP Cert No. 4092-002
OLCC No. 1002158CD2E

QC Report

Testing Accreditation #: 4092-002 Test Certificate #: 98760-001
Client Name, Sample Details

Chalice Farms
Portland, OR 97224
Sample: Pumpkin Spice Truffle
Type: Infused Product
Method: FE04E-OR4 HPLC1100-OR1
Metrc Test Pkg#: 1A4010300003E83000003307

Test Conditions

Prepsheet ID#: P171009A
Scale: XS205-OR1
Temp: 20 °C
Baro Pressure: 1009 hPa
Analyst: HRM
Technician: HRM

Sample ID#: 98760

Lot #: PST-171011
Batch #: 98760
Batch Weight (g): 15
Harvest/Process Date: 10/10/2017
Serving Size (g): 2.41
Package Weight (g):19.26
Date Received: 10/11/2017
Test Date: 10/13/2017

Sample #98760
Target Compound Name Method Blank (μg/g) LCS Spike (μg/g) LCS Amount (μg/g) Percent Recovery (%) LCS LCS Duplicate Amount (μg/g) Percent Recovery (%) LCSD Relative Percent Difference (%) QC Flag
Cannabidivarin (CBDV) N/D 5.59 5.68 101.61 5.63 100.72 0.88%
Cannabidiolic Acid (CBDA) N/D 5.3 5.62 106.04 5.55 104.72 1.25%
Cannabigerol (CBG) N/D 5.07 5.25 103.55 5.13 101.18 2.31%
Cannabidiol (CBD) N/D 4.82 5.05 104.77 4.94 102.49 2.20%
Δ9-Tetrahydrocannabivarin (THCV) N/D 5.31 5.41 101.88 5.43 102.26 0.37%
Cannabinol (CBN) N/D 4.73 4.84 102.33 4.76 100.63 1.67%
Δ9-Tetrahydrocannabinol (THC) N/D 4.93 4.99 101.22 4.86 98.58 2.64%
Cannabichromene (CBC) N/D 5.73 5.71 99.65 5.62 98.08 1.59%
Tetrahydrocannabinolic acid (THCA) N/D 4.78 5.33 111.51 5.22 109.21 2.09%

N.D. = Not Detected

LR = indicates compound recovery of matrix spike was outside the methods acceptable limits. (70-130%) Low recovery should be scrutinized for possible fail as it could indicate more compound present than is detected.

I = indicates that an amount of an interfering compound greater than the methods limit of detection was detected in the method blank sample. May indicate contamination of analytical system or consumables.

Q = indicates that the relative percent diference of two identicly prepared Matrix Spike samples for a target analyte was greater than 20%

HR = indicates compound recovery of matrix spike was outside the methods acceptable limits. (70-130%) high recoveries should be scrutinized for passing as more compound may be detected than is actually present in the sample.

SOP FE-01-OR9 was used in accordance with OAR 333-007 for sampling. All marijuana items are sampled and tested in accordance with OAR 333-007-0300 to 333-007-490 and OAR 333-064-0100 to 333-064-0110.

This certificate shall not be reproduced except in full, without written approval of Iron Laboratories, LLC.

Joseph Rutowski Iron laboratories Joseph Rutowski

Iron Labs Oregon complies with 2009 TNI Environmental Laboratory Standards.

Tested by Iron Laboratories Oregon, 71 Centennial Loop Suite D Eugene, OR 97401

Page 2 of 2

IRON Laboratories

Homogeneity Report

Test Certificate #: 98760-001
Client Name, Sample Details

Chalice Farms
Portland, OR 97224
Sample: Pumpkin Spice Truffle
Type: Infused Product
Metrc Test Pkg#: 1A4010300003E83000003307

Sample ID#: 98760

Lot #: PST-171011
Batch #: 98760
Batch Weight (g): 15
Harvest/Process Date: 10/10/2017
Serving Size (g): 2.41
Package Weight (g):19.26
Date Received: 10/11/2017

Sample #98760
Increments Tested (mg/g) TOTAL THC TOTAL CBD THC THCA THCV CBD CBC CBDA CBDV CBG CBN
Increment 1 2.24 0.01 2.24 N.D. 0.17 0.01 0.24 N.D. N.D. 0.07 0.04
Increment 2 2.34 0.01 2.34 N.D. 0.17 0.01 0.25 N.D. N.D. 0.07 0.04
Average Value 2.29 0.01 2.29 N.D. 0.17 0.01 0.25 N.D. N.D. 0.07 0.04
Max Value 2.34 0.01 2.34 N.D. 0.17 0.01 0.25 N.D. N.D. 0.07 0.04
Min Value 2.24 0.01 2.24 N.D. 0.17 0.01 0.24 N.D. N.D. 0.07 0.04
Relative Percent Difference (RPD) ±4.37 N.D. ±4.37 N.D. N.D. N.D. ±4.08 N.D. N.D. N.D. N.D.
Average Cannabinoids Per Package 44.11 0.19 44.11 N.D. 3.27 0.19 4.72 N.D. N.D. 1.35 0.77
Average Cannabinoids Per Serving 5.52 0.02 5.52 N.D. 0.41 0.02 0.59 N.D. N.D. 0.17 0.10
Max Concentration Per Serving (THC)   Pass
Max Concentration Per Package (THC)   Pass
Relative Percent Difference (RPD)   Pass
Control Study   No
Field Duplicate   Pass

N.D. = Not Detected, Min = Minimum, Max = Maximum

RPD is the relative percent difference between increment 1 and increment 2.

RSD is the relative standard deviation between all increments tested.

Total THC and CBD is the calculated sum of CBD or THC and the amount of CBD or THC derived from CBDA or THCA, respectively. These values are calculated by adding a molar correction factor of 0.877 to the CBDA or THCA value.

This certificate shall not be reproduced except in full, without written approval of Iron Laboratories, LLC.

Tested by Iron Laboratories Oregon, 71 Centennial Loop Suite D Eugene, OR 97401

Page 2 of 2